
แนะนำ Pandas (Introduction to Pandas)
Contents

แนะนำ Pandas (Introduction to Pandas)#
20 minutes
วัตถุประสงค์
หลังจากทำทำแล็บ นศ.จะสามารถ
ใช้งาน Pandas เข้าถึงและแสดงข้อมูลได้
Ref:
http://pandas.pydata.org/pandas-docs/stable/getting_started/index.html
https://www.kaggle.com/leonardodata/analysis-from-2010-2019-spotify
Dataset#
ตอนนี้ในมือของคุณมีชุดข้อมูล (Dataset) เพลง เป็นข้อมูลเพลงฮิตในแต่ละปีตั้งแต่ปี 2010 ถึงปี 2019 โดยข้อมูลอยู่ในรูปแบบของตาราง แต่ละแถว (row) ในตารางเป็นข้อมูลของเพลงแต่ละเพลง และแต่ละคอลัมน์ (column) มีข้อมูลดังต่อไปนี้
artist - ชื่อศิลปิน (นักร้อง วงดนตรี)
Top genre คือแนวเพลงหรือประเภทของแนวดนตรี
Year คือปีของเพลงที่อยู่ในบิลบอร์ด (Billboard)
Bpm (Tempo) คือจังหวะเร็วช้าขนาดไหน หน่วยเป็น bpm (Beats.Per.Minute)
Nrgy (Energy) คือพลังหรือความพุ่งของเพลง
Dnce (Danceability) คือความดิ้น หรือความน่าเต้นของเพลง
dB (Loudness) คือระดับความดังในหน่วย decibel
Live (Liveness) คือระดับของการแสดงสด (Live) ของเพลง
Val (Valence) คือระดับความ positive ในเพลง (ค่าต่ำ: เศร้า-หดหู่-โกรธ,คาสูง: มีความสุข-ให้กำลังใจ)
Dur (Length) - คือความยาว (ระยะเวลา) ของเพลง/ดนตรี
Acous (Acousticness) คือความ “acoustic” ของเพลง
Spch (Speechiness) คือปริมาณของคำพูดหรือเนื้อร้อง
Popularity คือระดับความนิยม ยิ่งค่าสูงเท่าไหร่ ยิ่งเป็นที่นิยม
ชุดข้อมูลที่ได้รับอยู่ในรูปตาราง (Format CSV)
(Source: spotifycharts.com, kaggle.com)
# |
title |
artist |
top genre |
year |
bpm |
nrgy |
dnce |
dB |
live |
val |
dur |
acous |
spch |
pop |
|---|---|---|---|---|---|---|---|---|---|---|---|---|---|---|
1 |
Memories |
Maroon 5 |
pop |
2019 |
91 |
32 |
76 |
-7 |
8 |
57 |
189 |
84 |
5 |
99 |
2 |
Lose You To Love Me |
Selena Gomez |
dance pop |
2019 |
102 |
34 |
51 |
-9 |
21 |
9 |
206 |
58 |
4 |
97 |
3 |
Someone You Loved |
Lewis Capaldi |
pop |
2019 |
110 |
41 |
50 |
-6 |
11 |
45 |
182 |
75 |
3 |
96 |
4 |
Senorita |
Shawn Mendes |
canadian pop |
2019 |
117 |
54 |
76 |
-6 |
9 |
75 |
191 |
4 |
3 |
95 |
5 |
How Do You Sleep? |
Sam Smith |
pop |
2019 |
111 |
68 |
48 |
-5 |
8 |
35 |
202 |
15 |
9 |
93 |
6 |
South of the Border (feat. Camila Cabello & Cardi B) |
Ed Sheeran |
pop |
2019 |
98 |
62 |
86 |
-6 |
9 |
67 |
204 |
15 |
8 |
92 |
7 |
Trampoline (with ZAYN) |
SHAED |
electropop |
2019 |
127 |
46 |
62 |
-6 |
14 |
50 |
184 |
56 |
3 |
92 |
8 |
Happier |
Marshmello |
brostep |
2019 |
100 |
79 |
69 |
-3 |
17 |
67 |
214 |
19 |
5 |
90 |
9 |
Truth Hurts |
Lizzo |
escape room |
2019 |
158 |
62 |
72 |
-3 |
12 |
41 |
173 |
11 |
11 |
90 |
10 |
Good as Hell (feat. Ariana Grande) - Remix |
Lizzo |
escape room |
2019 |
96 |
89 |
67 |
-3 |
74 |
48 |
159 |
30 |
6 |
90 |
11 |
Underneath the Tree |
Kelly Clarkson |
dance pop |
2013 |
160 |
81 |
51 |
-5 |
21 |
69 |
230 |
0 |
5 |
88 |
12 |
Higher Love |
Kygo |
edm |
2019 |
104 |
68 |
69 |
-7 |
10 |
40 |
228 |
2 |
3 |
88 |
13 |
Shape of You |
Ed Sheeran |
pop |
2017 |
96 |
65 |
83 |
-3 |
9 |
93 |
234 |
58 |
8 |
87 |
14 |
Only Human |
Jonas Brothers |
boy band |
2019 |
94 |
50 |
80 |
-6 |
6 |
87 |
183 |
11 |
7 |
87 |
15 |
All of Me |
John Legend |
neo mellow |
2014 |
120 |
26 |
42 |
-7 |
13 |
33 |
270 |
92 |
3 |
86 |
16 |
Closer |
The Chainsmokers |
electropop |
2017 |
95 |
52 |
75 |
-6 |
11 |
66 |
245 |
41 |
3 |
86 |
17 |
One Kiss (with Dua Lipa) |
Calvin Harris |
dance pop |
2018 |
124 |
86 |
79 |
-3 |
8 |
59 |
215 |
4 |
11 |
86 |
18 |
Beautiful People (feat. Khalid) |
Ed Sheeran |
pop |
2019 |
93 |
65 |
64 |
-8 |
8 |
55 |
198 |
12 |
19 |
86 |
19 |
Sucker |
Jonas Brothers |
boy band |
2019 |
138 |
73 |
84 |
-5 |
11 |
95 |
181 |
4 |
6 |
86 |
20 |
Don’t Call Me Up |
Mabel |
dance pop |
2019 |
99 |
88 |
67 |
-3 |
8 |
23 |
178 |
30 |
15 |
86 |
Pandas คือ?#
Pandas* เป็นไลบรารี่ที่ได้รับความนิยมอย่างมากอันหนึ่งของภาษาไพทอน ใช้ในการจัดการข้อมูล (Data wrangling/ Data cleaning) และการวิเคราะห์ข้อมูล (Data analysis) สามารถจัดการกับข้อมูลที่มีขนาดใหญ่ๆ ได้โดยที่ไม่มีปัญหา (ในขณะที่โปรแกรม Spreadsheets อย่าง Excel มีปัญหาเรื่องการประมวลผลช้าและไม่เสถียร)
หากทำงานเกี่ยวข้องกับ Data (เช่น Data Scientist) Pandas จะเป็นตัวเลือกหลัก เพราะ Pandas สามารถเชื่อมต่อการแหล่งข้อมูลได้หลากหลาย (เช่น CSV file, Text file, Microsoft Excel, Clipboard, HDFS format, Google BIg Query, Oracle database, URL, HTML, JSON file) หลังจากนั้นก็สามารถจัดเตรียมข้อมูล (Data preparation) ทำความสะอาดข้อมูล (Data cleansing/Data scrubbing) และจัดรูปแบบให้พร้อมกับการนำไปวิเคราะห์ (Data analytics) จนถึงแสดงผล (Data visualization) เบื้องต้นก็ได้
เนื่องจาก Pandas ไม่ใช่โมดูลมาตรฐานของไพทอน ดังนั้น ก่อนจะใช้งานจำเป็นต้องติดตั้งลงเครื่องก่อน (pip install หรือ conda install)
เราจะเริ่มต้นเขียนโปรแกรมโดยการ import เข้ามา ณ ที่นี้จะตั้งชื่อว่า pd เพื่อให้เวลาเรียกใช้งานฟังก์ชันจะได้เขียนง่ายๆ เช่น pd.read_csv()
(*Pandas มาจาก Panel data ซึ่งหมายถึงข้อมูลที่มีหลายมิติ)
การอ่านข้อมูลจากไฟล์ในรูปแบบ DataFrame#
Import ไลบรารี่ที่จะใช้งาน
import pandas as pd
เช็ค Version#
print ("Pandas version",pd.__version__)
Pandas version 1.5.1
ดาวน์โหลดชุดข้อมูลไฟล์ CSV เข้าสู่โปรแกรมในรูปแบบ DataFrame
The top songs BY YEAR in the world by spotify. This dataset has several variables about the songs and is based on Billboard.
(ชุดข้อมูลข้างต้นสามารถดาวโหลดได้จาก spotifycharts.com หรือ kaggle.com โดยข้อมูลดิบจะเรียงตามปี (Year) ในรูปของไฟล์ CSV (Comma-Separated Values) )
ก่อนอื่น เราจะโหลดไฟล์ข้อมูล csv ที่อยู่ในเครื่องของเราเข้าสู่ไพทอนในรูปแบบ DataFrame (DataFrame คือ ตารางข้อมูลที่ถูกแบ่งเป็นแถวและคอลัมน์เหมือน Excel) โดยใช้ฟังก์ชัน read_csv()
ตัวแปร csv_path เก็บที่อยู่ของไฟล์ (path) .csv ส่งเป็นอาร์กิวเมนต์ให้กับฟังก์ชั่น read_csv ผลลัพธ์จะถูกเก็บในออบเจ็กต์ชื่อ df ซึ่งเป็นชื่อย่อของตัวแปรที่นิยมใช้เก็บ DataFrame
# Read data from CSV file
csv_path = 'docs/Top_Spotify_songs_from_2010_2019.csv'
df = pd.read_csv(csv_path, encoding='ISO-8859-1')
หมายเหตุ: ASCII: 7 bit, ISO-8859-1: 8 bits, UTF-8: 8-32 bits
เราสามารถแสดงตัวอย่างข้อมูล (Preview) 5 แถวบนสุดและ 5 แถวล่างสุดของ Dataframe ได้โดยใช้ฟังก์ชัน ใช้เมธอด head() และ tail() ตามลำดับ
# Print first five rows of the dataframe

df.head()
| Unnamed: 0 | title | artist | top genre | year | bpm | nrgy | dnce | dB | live | val | dur | acous | spch | pop | |
|---|---|---|---|---|---|---|---|---|---|---|---|---|---|---|---|
| 0 | 1 | Hey, Soul Sister | Train | neo mellow | 2010 | 97 | 89 | 67 | -4 | 8 | 80 | 217 | 19 | 4 | 83 |
| 1 | 2 | Love The Way You Lie | Eminem | detroit hip hop | 2010 | 87 | 93 | 75 | -5 | 52 | 64 | 263 | 24 | 23 | 82 |
| 2 | 3 | TiK ToK | Kesha | dance pop | 2010 | 120 | 84 | 76 | -3 | 29 | 71 | 200 | 10 | 14 | 80 |
| 3 | 4 | Bad Romance | Lady Gaga | dance pop | 2010 | 119 | 92 | 70 | -4 | 8 | 71 | 295 | 0 | 4 | 79 |
| 4 | 5 | Just the Way You Are | Bruno Mars | pop | 2010 | 109 | 84 | 64 | -5 | 9 | 43 | 221 | 2 | 4 | 78 |
จะกำหนดจำนวนแถวที่ต้องการแสดงผลก็ทำได้ เช่น
df.head(2)
| Unnamed: 0 | title | artist | top genre | year | bpm | nrgy | dnce | dB | live | val | dur | acous | spch | pop | |
|---|---|---|---|---|---|---|---|---|---|---|---|---|---|---|---|
| 0 | 1 | Hey, Soul Sister | Train | neo mellow | 2010 | 97 | 89 | 67 | -4 | 8 | 80 | 217 | 19 | 4 | 83 |
| 1 | 2 | Love The Way You Lie | Eminem | detroit hip hop | 2010 | 87 | 93 | 75 | -5 | 52 | 64 | 263 | 24 | 23 | 82 |
ในกรณีที่ข้อมูลเป็นไฟล์ excel (.xlsx, .xls) Pandas จะใช้ไลบรารี xlrd โดยเรียกใช้ใช้ฟังก์ชั่น read_excel() ซึ่งผลลัพท์ที่ได้จะเป็น Dataframe เช่นเดียวกัน
# Read data from Excel File and print the first five rows

xlsx_path = 'docs/Top_Spotify_songs_from_2010_2019.xlsx'

df = pd.read_excel(xlsx_path)
df.tail(2)
| Unnamed: 0 | title | artist | top genre | year | bpm | nrgy | dnce | dB | live | val | dur | acous | spch | pop | |
|---|---|---|---|---|---|---|---|---|---|---|---|---|---|---|---|
| 601 | 602 | Nothing Breaks Like a Heart (feat. Miley Cyrus) | Mark Ronson | dance pop | 2019 | 114 | 79 | 60 | -6 | 42 | 24 | 217 | 1 | 7 | 69 |
| 602 | 603 | Kills You Slowly | The Chainsmokers | electropop | 2019 | 150 | 44 | 70 | -9 | 13 | 23 | 213 | 6 | 6 | 67 |
ในกรณีที่เกิด Error “XLRDError: Excel xlsx file; not supported” ให้ทำการติดตั้ง xlrd โดยใช้คำสั่งต่อไปนี้ แล้วลองโหลดใหม่ดูอีกที
# Dependency needed to install file
# Pandas.read_excel a.) uses a library called xlrd internally.

!pip install xlrd
Requirement already satisfied: xlrd in /Users/tube.sc/.pyenv/versions/3.8.13/lib/python3.8/site-packages (2.0.1)
ตรวจสอบชุดข้อมูล#
เช็คจำนวนแถวและจำนวนคอลัมน์ ใน Pandas มีวิธีเช็คจำนวนแถวและจำนวนคอลัมน์ได้ง่ายๆ โดยใช้
df.shape
(603, 15)
ชุดข้อมูลมี 603 rows และ 15 columns
ดูค่าสถิติเบื้องต้นของข้อมูลแต่ละ column ใน DataFrame เช่น mean (ค่าเฉลี่ย), median (ค่ากลาง), standard deviation (std), min (ค่าต่ำสุด), max (ค่าสูงสุด) ฯลฯ
df.describe()
| Unnamed: 0 | year | bpm | nrgy | dnce | dB | live | val | dur | acous | spch | pop | |
|---|---|---|---|---|---|---|---|---|---|---|---|---|
| count | 603.000000 | 603.000000 | 603.000000 | 603.000000 | 603.000000 | 603.000000 | 603.000000 | 603.000000 | 603.000000 | 603.000000 | 603.000000 | 603.000000 |
| mean | 302.000000 | 2014.592040 | 118.545605 | 70.504146 | 64.379768 | -5.578773 | 17.774461 | 52.225539 | 224.674959 | 14.326700 | 8.358209 | 66.520730 |
| std | 174.215384 | 2.607057 | 24.795358 | 16.310664 | 13.378718 | 2.798020 | 13.102543 | 22.513020 | 34.130059 | 20.766165 | 7.483162 | 14.517746 |
| min | 1.000000 | 2010.000000 | 0.000000 | 0.000000 | 0.000000 | -60.000000 | 0.000000 | 0.000000 | 134.000000 | 0.000000 | 0.000000 | 0.000000 |
| 25% | 151.500000 | 2013.000000 | 100.000000 | 61.000000 | 57.000000 | -6.000000 | 9.000000 | 35.000000 | 202.000000 | 2.000000 | 4.000000 | 60.000000 |
| 50% | 302.000000 | 2015.000000 | 120.000000 | 74.000000 | 66.000000 | -5.000000 | 12.000000 | 52.000000 | 221.000000 | 6.000000 | 5.000000 | 69.000000 |
| 75% | 452.500000 | 2017.000000 | 129.000000 | 82.000000 | 73.000000 | -4.000000 | 24.000000 | 69.000000 | 239.500000 | 17.000000 | 9.000000 | 76.000000 |
| max | 603.000000 | 2019.000000 | 206.000000 | 98.000000 | 97.000000 | -2.000000 | 74.000000 | 98.000000 | 424.000000 | 99.000000 | 48.000000 | 99.000000 |
หรือจะดูเฉพาะ mean (ค่าเฉลี่ย), median (ค่ากลาง), standard deviation (std), min (ค่าต่ำสุด), max (ค่าสูงสุด) ก็สามารถทำได้
df.mean()
/var/folders/nb/qx4_7k_n2mx3zzwh39qtrg_c0000gn/T/ipykernel_82235/3698961737.py:1: FutureWarning: The default value of numeric_only in DataFrame.mean is deprecated. In a future version, it will default to False. In addition, specifying 'numeric_only=None' is deprecated. Select only valid columns or specify the value of numeric_only to silence this warning.
  df.mean()
Unnamed: 0     302.000000
year          2014.592040
bpm            118.545605
nrgy            70.504146
dnce            64.379768
dB              -5.578773
live            17.774461
val             52.225539
dur            224.674959
acous           14.326700
spch             8.358209
pop             66.520730
dtype: float64
df.median()
/var/folders/nb/qx4_7k_n2mx3zzwh39qtrg_c0000gn/T/ipykernel_82235/530051474.py:1: FutureWarning: The default value of numeric_only in DataFrame.median is deprecated. In a future version, it will default to False. In addition, specifying 'numeric_only=None' is deprecated. Select only valid columns or specify the value of numeric_only to silence this warning.
  df.median()
Unnamed: 0     302.0
year          2015.0
bpm            120.0
nrgy            74.0
dnce            66.0
dB              -5.0
live            12.0
val             52.0
dur            221.0
acous            6.0
spch             5.0
pop             69.0
dtype: float64
df.std()
/var/folders/nb/qx4_7k_n2mx3zzwh39qtrg_c0000gn/T/ipykernel_82235/3390915376.py:1: FutureWarning: The default value of numeric_only in DataFrame.std is deprecated. In a future version, it will default to False. In addition, specifying 'numeric_only=None' is deprecated. Select only valid columns or specify the value of numeric_only to silence this warning.
  df.std()
Unnamed: 0    174.215384
year            2.607057
bpm            24.795358
nrgy           16.310664
dnce           13.378718
dB              2.798020
live           13.102543
val            22.513020
dur            34.130059
acous          20.766165
spch            7.483162
pop            14.517746
dtype: float64
df.min()
/var/folders/nb/qx4_7k_n2mx3zzwh39qtrg_c0000gn/T/ipykernel_82235/3962516015.py:1: FutureWarning: The default value of numeric_only in DataFrame.min is deprecated. In a future version, it will default to False. In addition, specifying 'numeric_only=None' is deprecated. Select only valid columns or specify the value of numeric_only to silence this warning.
  df.min()
Unnamed: 0               1
artist               3OH!3
top genre     acoustic pop
year                  2010
bpm                      0
nrgy                     0
dnce                     0
dB                     -60
live                     0
val                      0
dur                    134
acous                    0
spch                     0
pop                      0
dtype: object
df.max()
/var/folders/nb/qx4_7k_n2mx3zzwh39qtrg_c0000gn/T/ipykernel_82235/1151452817.py:1: FutureWarning: The default value of numeric_only in DataFrame.max is deprecated. In a future version, it will default to False. In addition, specifying 'numeric_only=None' is deprecated. Select only valid columns or specify the value of numeric_only to silence this warning.
  df.max()
Unnamed: 0               603
artist             will.i.am
top genre     tropical house
year                    2019
bpm                      206
nrgy                      98
dnce                      97
dB                        -2
live                      74
val                       98
dur                      424
acous                     99
spch                      48
pop                       99
dtype: object
เช็คความผิดปกติใน DataFrame เบื้องต้น
หากเราใช้ฟังชั่น info() เราก็จะทราบว่าข้อมูลเบื้องต้นของ DataFrame เช่น มีกี่แถว, มีกี่คอลัมน์, Missing value มีมากน้อยเท่าไหร่, แต่ละคอลัมน์เป็น Data Type อะไรบ้าง ซึ่งเป็นการเช็คหาความผิดปกติใน DataFrame เบื้องต้นได้
df.info()
<class 'pandas.core.frame.DataFrame'>
RangeIndex: 603 entries, 0 to 602
Data columns (total 15 columns):
 #   Column      Non-Null Count  Dtype
---  ------      --------------  -----
 0   Unnamed: 0  603 non-null    int64
 1   title       603 non-null    object
 2   artist      603 non-null    object
 3   top genre   603 non-null    object
 4   year        603 non-null    int64
 5   bpm         603 non-null    int64
 6   nrgy        603 non-null    int64
 7   dnce        603 non-null    int64
 8   dB          603 non-null    int64
 9   live        603 non-null    int64
 10  val         603 non-null    int64
 11  dur         603 non-null    int64
 12  acous       603 non-null    int64
 13  spch        603 non-null    int64
 14  pop         603 non-null    int64
dtypes: int64(12), object(3)
memory usage: 70.8+ KB
ชุดข้อมูลนี้ไม่มีช่องใดที่มีค่าเป็น NaN (ไม่มีข้อมูล)
df.columns
Index(['Unnamed: 0', 'title', 'artist', 'top genre', 'year', 'bpm', 'nrgy',
       'dnce', 'dB', 'live', 'val', 'dur', 'acous', 'spch', 'pop'],
      dtype='object')
df.dtypes
Unnamed: 0     int64
title         object
artist        object
top genre     object
year           int64
bpm            int64
nrgy           int64
dnce           int64
dB             int64
live           int64
val            int64
dur            int64
acous          int64
spch           int64
pop            int64
dtype: object
แสดง index ของ DataFrame ตอนสร้าง DataFrame ถ้าไม่ได้กำหนด index จะเป็นเลขลำดับ 0, 1, 2, 3, … โดยอัตโนมัติ
df.index
RangeIndex(start=0, stop=603, step=1)
✄ ———- เพิ่มเติม ———– ✄
# ******************************************************************
df.isnull().sum() # ตรวจสอบค่า null values ว่าในแต่ละคอลัมน์มีอยู่กี่ค่า
Unnamed: 0    0
title         0
artist        0
top genre     0
year          0
bpm           0
nrgy          0
dnce          0
dB            0
live          0
val           0
dur           0
acous         0
spch          0
pop           0
dtype: int64
df.count() # นับจำนวนข้อมูลในแต่ละคอลัมน์
Unnamed: 0    603
title         603
artist        603
top genre     603
year          603
bpm           603
nrgy          603
dnce          603
dB            603
live          603
val           603
dur           603
acous         603
spch          603
pop           603
dtype: int64
#******************************************************************
ตรวจสอบจำนวนเพลงที่…
ชื่อเพลงไม่ซ้ำกัน 584 เพลง
ชื่อศิลปินไม่ซ้ำกัน 184 เพลง
# ดูค่า nunique ของแต่ละคอลัมน์ (Count number of distinct elements in specified axis.

df.nunique()
Unnamed: 0    603
title         584
artist        184
top genre      50
year           10
bpm           104
nrgy           77
dnce           70
dB             14
live           61
val            94
dur           144
acous          75
spch           39
pop            71
dtype: int64
# ✄ ****************************************************************** ✄
การเข้าถึงข้อมูล (เบื้องต้น)#
การเข้าถึง Column
เราสามารถดูข้อมูลหรือเข้าถึง column ที่ต้องได้ โดยการใส่ชื่อคอลัมน์เป็น string ในวงเล็บเหลี่ยม [] (วงเล็บเดี่ยว) หรือใช้ชื่อคอลัมน์เป็นชื่อ attribute ก็ได้
Pandas มีออบเจ็กต์พิเศษ 2 ชนิดสำหรับใช้บรรจุข้อมูล ซีรีส์ (Pandas series) และ เดตาเฟรม (Pandas dataFrame)) ดังแสดงในรูป
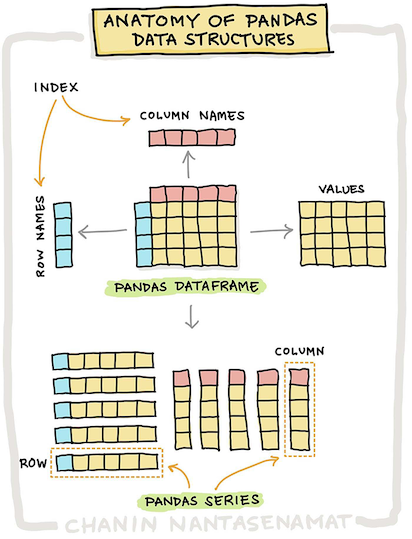 [src] (https://towardsdatascience.com/how-to-master-pandas-for-data-science-b8ab0a9b1042)
# Access to the column year
y = df['year']
y
0      2010
1      2010
2      2010
3      2010
4      2010
       ...
598    2019
599    2019
600    2019
601    2019
602    2019
Name: year, Length: 603, dtype: int64
y = df.year
y
0      2010
1      2010
2      2010
3      2010
4      2010
       ...
598    2019
599    2019
600    2019
601    2019
602    2019
Name: year, Length: 603, dtype: int64
type(y)
pandas.core.series.Series
ผลลัพธ์ที่ได้เป็น 1 column เรียกว่า Panda series (1-D dataframe)
ในกรณีที่ต้องการให้เป็น Dataframe ก็สามารถทำได้โดยใช้ วงเล็บเหลี่ยม [[ ]] (วงเล็บคู่) เช่น column artist
# Get the column as a dataframe
y = df[['artist']]
y
| artist | |
|---|---|
| 0 | Train |
| 1 | Eminem |
| 2 | Kesha |
| 3 | Lady Gaga |
| 4 | Bruno Mars |
| ... | ... |
| 598 | Mark Ronson |
| 599 | Ed Sheeran |
| 600 | DJ Khaled |
| 601 | Mark Ronson |
| 602 | The Chainsmokers |
603 rows × 1 columns
type(y)
pandas.core.frame.DataFrame
หากต้องการหลายคอลัมน์ก็สามารถทำได้ แค่ใส่ชื่อ dataframe ในกรณีนี้คือ df และชื่อของชื่อของคอลัมน์ที่ต้องการในวงเล็บคู่
# Access to multiple columns
y = df[['artist','year','top genre']]
y
| artist | year | top genre | |
|---|---|---|---|
| 0 | Train | 2010 | neo mellow |
| 1 | Eminem | 2010 | detroit hip hop |
| 2 | Kesha | 2010 | dance pop |
| 3 | Lady Gaga | 2010 | dance pop |
| 4 | Bruno Mars | 2010 | pop |
| ... | ... | ... | ... |
| 598 | Mark Ronson | 2019 | dance pop |
| 599 | Ed Sheeran | 2019 | pop |
| 600 | DJ Khaled | 2019 | dance pop |
| 601 | Mark Ronson | 2019 | dance pop |
| 602 | The Chainsmokers | 2019 | electropop |
603 rows × 3 columns
<img src = “images/DataEgTwo.png)
จัดเรียงข้อมูล (Sorting): sort_index(), sort_values()
sort_index()เรียงลำดับ row ตามค่าของ indexsort_values()เรียงลำดับ row ตามค่าของ column ที่กำหนด
df.sort_values(by='bpm')
| Unnamed: 0 | title | artist | top genre | year | bpm | nrgy | dnce | dB | live | val | dur | acous | spch | pop | |
|---|---|---|---|---|---|---|---|---|---|---|---|---|---|---|---|
| 442 | 443 | Million Years Ago | Adele | british soul | 2016 | 0 | 0 | 0 | -60 | 0 | 0 | 227 | 0 | 0 | 0 |
| 44 | 45 | You Lost Me | Christina Aguilera | dance pop | 2010 | 43 | 39 | 23 | -6 | 14 | 7 | 257 | 85 | 4 | 56 |
| 87 | 88 | 1+1 | BeyoncÈ | dance pop | 2011 | 63 | 38 | 30 | -7 | 7 | 26 | 274 | 38 | 3 | 60 |
| 5 | 6 | Baby | Justin Bieber | canadian pop | 2010 | 65 | 86 | 73 | -5 | 11 | 54 | 214 | 4 | 14 | 77 |
| 460 | 461 | Praying | Kesha | dance pop | 2017 | 73 | 39 | 58 | -7 | 11 | 32 | 230 | 49 | 3 | 77 |
| ... | ... | ... | ... | ... | ... | ... | ... | ... | ... | ... | ... | ... | ... | ... | ... |
| 314 | 315 | I'll Show You | Justin Bieber | canadian pop | 2015 | 192 | 61 | 36 | -7 | 18 | 8 | 200 | 5 | 10 | 68 |
| 462 | 463 | The Greatest | Sia | australian dance | 2017 | 192 | 73 | 67 | -6 | 6 | 73 | 210 | 1 | 27 | 76 |
| 200 | 201 | How Ya Doin'? (feat. Missy Elliott) | Little Mix | dance pop | 2013 | 201 | 95 | 36 | -3 | 37 | 51 | 211 | 9 | 48 | 50 |
| 362 | 363 | L.A.LOVE (la la) | Fergie | dance pop | 2015 | 202 | 39 | 48 | -8 | 26 | 27 | 193 | 2 | 9 | 0 |
| 276 | 277 | FourFiveSeconds | Rihanna | barbadian pop | 2015 | 206 | 27 | 58 | -6 | 13 | 35 | 188 | 88 | 5 | 80 |
603 rows × 15 columns
df.sort_index()
| Unnamed: 0 | title | artist | top genre | year | bpm | nrgy | dnce | dB | live | val | dur | acous | spch | pop | |
|---|---|---|---|---|---|---|---|---|---|---|---|---|---|---|---|
| 0 | 1 | Hey, Soul Sister | Train | neo mellow | 2010 | 97 | 89 | 67 | -4 | 8 | 80 | 217 | 19 | 4 | 83 |
| 1 | 2 | Love The Way You Lie | Eminem | detroit hip hop | 2010 | 87 | 93 | 75 | -5 | 52 | 64 | 263 | 24 | 23 | 82 |
| 2 | 3 | TiK ToK | Kesha | dance pop | 2010 | 120 | 84 | 76 | -3 | 29 | 71 | 200 | 10 | 14 | 80 |
| 3 | 4 | Bad Romance | Lady Gaga | dance pop | 2010 | 119 | 92 | 70 | -4 | 8 | 71 | 295 | 0 | 4 | 79 |
| 4 | 5 | Just the Way You Are | Bruno Mars | pop | 2010 | 109 | 84 | 64 | -5 | 9 | 43 | 221 | 2 | 4 | 78 |
| ... | ... | ... | ... | ... | ... | ... | ... | ... | ... | ... | ... | ... | ... | ... | ... |
| 598 | 599 | Find U Again (feat. Camila Cabello) | Mark Ronson | dance pop | 2019 | 104 | 66 | 61 | -7 | 20 | 16 | 176 | 1 | 3 | 75 |
| 599 | 600 | Cross Me (feat. Chance the Rapper & PnB Rock) | Ed Sheeran | pop | 2019 | 95 | 79 | 75 | -6 | 7 | 61 | 206 | 21 | 12 | 75 |
| 600 | 601 | No Brainer (feat. Justin Bieber, Chance the Ra... | DJ Khaled | dance pop | 2019 | 136 | 76 | 53 | -5 | 9 | 65 | 260 | 7 | 34 | 70 |
| 601 | 602 | Nothing Breaks Like a Heart (feat. Miley Cyrus) | Mark Ronson | dance pop | 2019 | 114 | 79 | 60 | -6 | 42 | 24 | 217 | 1 | 7 | 69 |
| 602 | 603 | Kills You Slowly | The Chainsmokers | electropop | 2019 | 150 | 44 | 70 | -9 | 13 | 23 | 213 | 6 | 6 | 67 |
603 rows × 15 columns
การดูข้อมูลและการเข้าถึงข้อมูล: iloc()
วิธีหนึ่งในการเข้าถึงข้อมูลแต่ละช่องคือใช้เมธอด iloc() (integer-location based indexing)
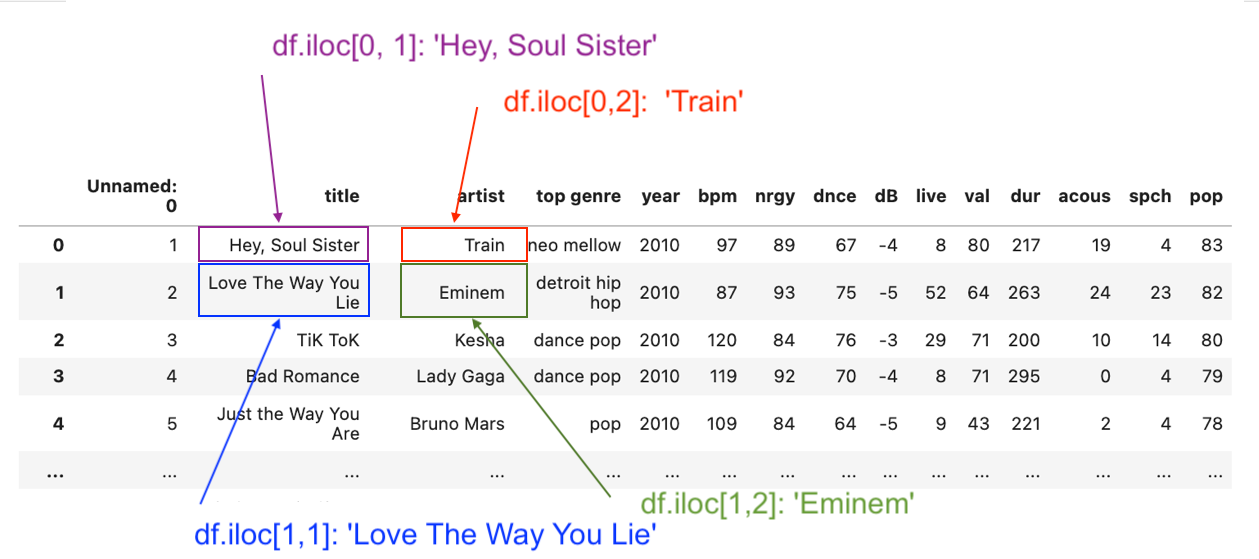
ยกตัวอย่าง เราสามารถเข้าถึงแถวที่ 1 และคอลัมน์ที่ 2 ได้ดังนี้
# Access the value on the first row and the first column
df.iloc[0, 1]
'Hey, Soul Sister'
ถ้าเป็นแถวที่ 1 และคอลัมน์ที่ 3 เขียนได้ดังนี้
# Access the value on the second row and the first column
df.iloc[0,2]
'Train'
เข้าถึงแถวที่ 2 และคอลัมน์ที่ 2 และแถวที่ 2 และคอลัมน์ที่ 3 ได้ดังนี้
# Access the value on the first row and the third column
df.iloc[1,1]
'Love The Way You Lie'
# Access the value on the second row and the third column
df.iloc[1,2]
'Eminem'
แสดงได้ดังรูป
นอกจากจะใช้ index แล้วเรายังสามารถเข้าถึงคอลัมน์โดยใช้ชื่อได้เช่นกันโดยใช้เมธอด loc() (location based indexing) (ผลลัพธ์เหมือนกับก่อนหน้านี้)
# Access the column using the name

df.loc[0, 'title']
'Hey, Soul Sister'
# Access the column using the name

df.loc[0, 'artist']
'Train'
# Access the column using the name

df.loc[1, 'title']
'Love The Way You Lie'
# Access the column using the name

df.loc[1, 'artist']
'Eminem'
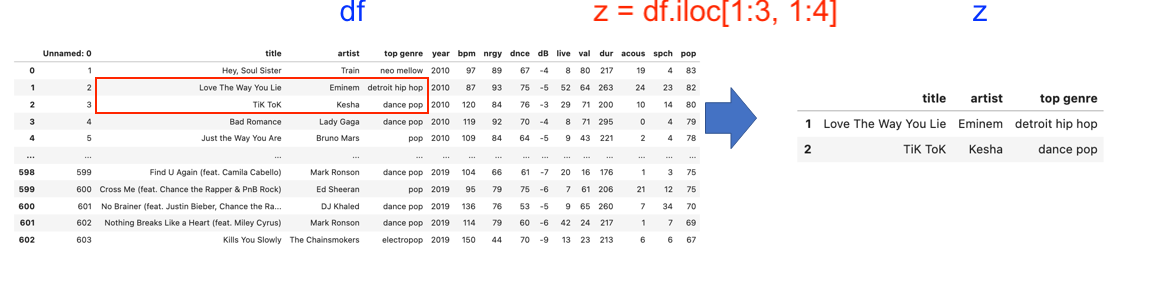
การตัด (Slicing)
เราสามารถทำการตัดข้อมูลโดยใช้ทั้งดัชนีและชื่อของคอลัมน์ได้
# Slicing the dataframe

z = df.iloc[1:3, 1:4]
z
| title | artist | top genre | |
|---|---|---|---|
| 1 | Love The Way You Lie | Eminem | detroit hip hop |
| 2 | TiK ToK | Kesha | dance pop |
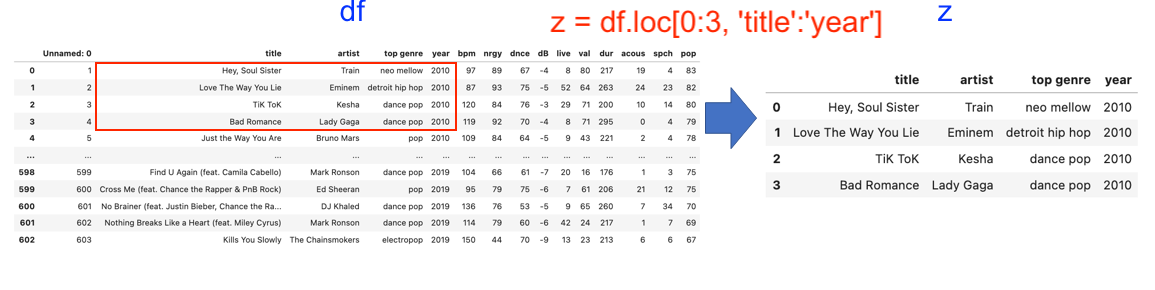
# Slicing the dataframe using name

z = df.loc[0:3, 'title':'year']
z
| title | artist | top genre | year | |
|---|---|---|---|---|
| 0 | Hey, Soul Sister | Train | neo mellow | 2010 |
| 1 | Love The Way You Lie | Eminem | detroit hip hop | 2010 |
| 2 | TiK ToK | Kesha | dance pop | 2010 |
| 3 | Bad Romance | Lady Gaga | dance pop | 2010 |
การจัดกลุ่มข้อมูลตาม column ที่กำหนด: groupby()
จัดกลุ่มข้อมูลตาม column ที่กำหนดโดยใช้เมธอด groupby()
df.groupby('year').median()
/var/folders/nb/qx4_7k_n2mx3zzwh39qtrg_c0000gn/T/ipykernel_82235/130325292.py:1: FutureWarning: The default value of numeric_only in DataFrameGroupBy.median is deprecated. In a future version, numeric_only will default to False. Either specify numeric_only or select only columns which should be valid for the function.
  df.groupby('year').median()
| Unnamed: 0 | bpm | nrgy | dnce | dB | live | val | dur | acous | spch | pop | |
|---|---|---|---|---|---|---|---|---|---|---|---|
| year | |||||||||||
| 2010 | 26.0 | 125.0 | 82.0 | 67.0 | -5.0 | 13.0 | 61.0 | 221.0 | 3.0 | 5.0 | 65.0 |
| 2011 | 78.0 | 126.0 | 78.0 | 65.0 | -5.0 | 14.0 | 57.0 | 231.0 | 5.0 | 5.0 | 66.0 |
| 2012 | 122.0 | 125.0 | 79.0 | 67.0 | -5.0 | 12.0 | 68.0 | 225.0 | 2.0 | 5.0 | 72.0 |
| 2013 | 175.0 | 126.0 | 78.0 | 63.0 | -5.0 | 13.0 | 52.0 | 227.0 | 4.0 | 5.0 | 67.0 |
| 2014 | 239.5 | 125.0 | 72.0 | 63.5 | -6.0 | 13.5 | 54.0 | 223.5 | 8.0 | 5.0 | 65.0 |
| 2015 | 316.0 | 120.0 | 75.0 | 67.0 | -5.0 | 13.0 | 52.0 | 220.0 | 6.0 | 5.0 | 68.0 |
| 2016 | 403.5 | 113.0 | 71.0 | 63.0 | -6.0 | 13.0 | 43.0 | 217.5 | 5.5 | 6.0 | 69.0 |
| 2017 | 476.0 | 106.0 | 72.0 | 68.0 | -5.0 | 12.0 | 54.0 | 222.0 | 9.0 | 6.0 | 71.0 |
| 2018 | 540.5 | 110.0 | 67.0 | 67.5 | -6.0 | 11.5 | 47.5 | 211.5 | 5.0 | 6.0 | 74.5 |
| 2019 | 588.0 | 104.0 | 68.0 | 70.0 | -6.0 | 10.0 | 52.0 | 202.0 | 13.0 | 5.0 | 85.0 |
df.groupby('artist').mean().head()
/var/folders/nb/qx4_7k_n2mx3zzwh39qtrg_c0000gn/T/ipykernel_82235/3811477203.py:1: FutureWarning: The default value of numeric_only in DataFrameGroupBy.mean is deprecated. In a future version, numeric_only will default to False. Either specify numeric_only or select only columns which should be valid for the function.
  df.groupby('artist').mean().head()
| Unnamed: 0 | year | bpm | nrgy | dnce | dB | live | val | dur | acous | spch | pop | |
|---|---|---|---|---|---|---|---|---|---|---|---|---|
| artist | ||||||||||||
| 3OH!3 | 32.0 | 2010.0 | 138.0 | 89.0 | 68.0 | -4.0 | 36.0 | 83.0 | 192.0 | 1.0 | 8.0 | 62.0 |
| 5 Seconds of Summer | 230.0 | 2014.0 | 160.0 | 95.0 | 49.0 | -4.0 | 33.0 | 44.0 | 202.0 | 0.0 | 13.0 | 71.0 |
| A Great Big World | 250.0 | 2014.0 | 138.0 | 15.0 | 45.0 | -9.0 | 9.0 | 9.0 | 229.0 | 87.0 | 3.0 | 61.0 |
| Adam Lambert | 30.0 | 2010.0 | 158.5 | 79.5 | 54.5 | -4.5 | 21.5 | 62.0 | 227.5 | 1.0 | 8.0 | 62.5 |
| Adele | 317.8 | 2014.7 | 119.3 | 47.3 | 52.3 | -11.4 | 10.4 | 35.4 | 257.5 | 35.3 | 4.0 | 61.5 |
[Exercise]#
จงเขียนโค้ด กำหนดให้ตัวแปร
qเก็บข้อมูลคอลัมน์ title ในรูปแบบของ dataframe
# Write your code below and press Shift+Enter to execute
เขียนโค้ดกำหนดค่าให้ตัวแปร
qเก็บ dataframe ที่ประกอบด้วยคอลัมน์ artist title และ year
# Write your code below and press Shift+Enter to execute
เขียนโค้ดเข้าถึงข้อมูลที่อยู่ในแถวที่ 102 และคอลัมน์ที่ 3 ของ
df
# Write your code below and press Shift+Enter to execute
ค้นหาชื่อเพลงที่มีค่า
nrgyต่ำสุดและสูงสุด
# Write your code below and press Shift+Enter to execute
Change Log#
Date |
Version |
Change Description |
|---|---|---|
08-08-2021 |
0.1 |
First edition |